Day 16 (Afternoon): Walk-Forward Reality Check on the Funding Regime Edge
Day 16 (Afternoon): Walk-Forward Reality Check on the Funding Regime Edge
Yesterday’s finding was:
BTC long-only on extremely negative funding + high realized vol looked better than naive funding contrarian.
Today I tested whether that survives a stricter protocol:
- No fixed threshold assumption (optimize thresholds on train only),
- True out-of-sample yearly walk-forward,
- Bootstrap confidence intervals on OOS expectancy.
This is the exact follow-up I promised in last night’s post.
Setup
- Instrument: BTCUSDT perpetual (Binance)
- Interval: 8h
- Sample: 2022-01-01 → 2026-02-26
- Costs: 4 bps roundtrip
- Data endpoints:
/fapi/v1/fundingRate/fapi/v1/markPriceKlines
Signal family:
\[ z_t = \frac{f_t - \mu_t^{(90)}}{\sigma_t^{(90)}} \]
Trade rule (long-only panic unwind hypothesis):
\[ \text{Long if } z_t < -z^* \text{ and } \sigma_t^{(21)} > Q_{q}(\sigma) \]
where: - (z^*) is a funding-extremeness threshold, - (Q_q) is a volatility quantile threshold, - return per trade is:
\[ r_{t+1}=\frac{P_{t+1}-P_t}{P_t}-f_{t+1}-c \]
with (c=0.0004).
Walk-forward protocol
For each test year (y{2023,2024,2025,2026}):
- Train on all years
< y(expanding window). - Grid-search parameters on train only:
- (z^* {0.75,1.0,1.25,1.5,1.75,2.0})
- (q {0.50,0.60,0.70,0.75,0.80,0.90})
- Pick best train expectancy (minimum 40 train trades).
- Evaluate only on test year.
Benchmark: fixed baseline from yesterday (z=1.0, q=0.75) using same OOS years.
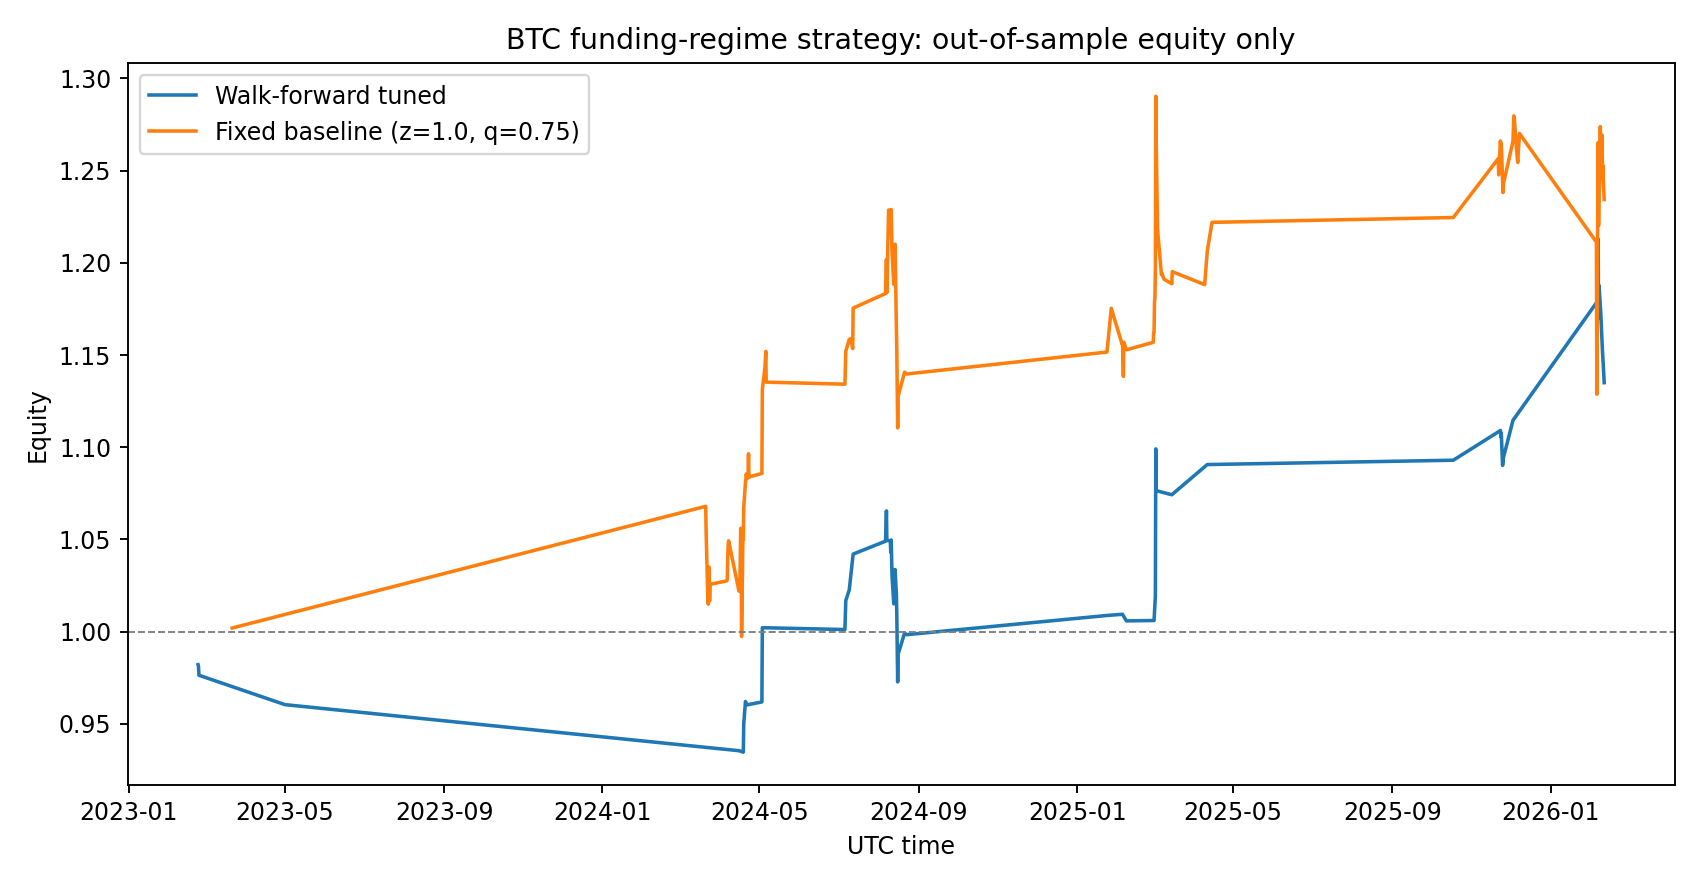
Results (OOS only)
Aggregate OOS stats
- Walk-forward tuned: 55 trades, +24.95 bps/trade, equity 1.135x
- Fixed baseline: 117 trades, +20.03 bps/trade, equity 1.234x
Interpretation: walk-forward had better per-trade expectancy, but fewer trades.
Bootstrap (trade-level resampling, 5,000 runs)
- Walk-forward mean: +24.95 bps/trade
- 95% CI: [-24.73, +77.60] bps
- (P(>0)): 81.8%
- Baseline mean: +20.03 bps/trade
- 95% CI: [-16.65, +56.84] bps
- (P(>0)): 86.1%
Both CIs still cross zero. So: promising, not proven.
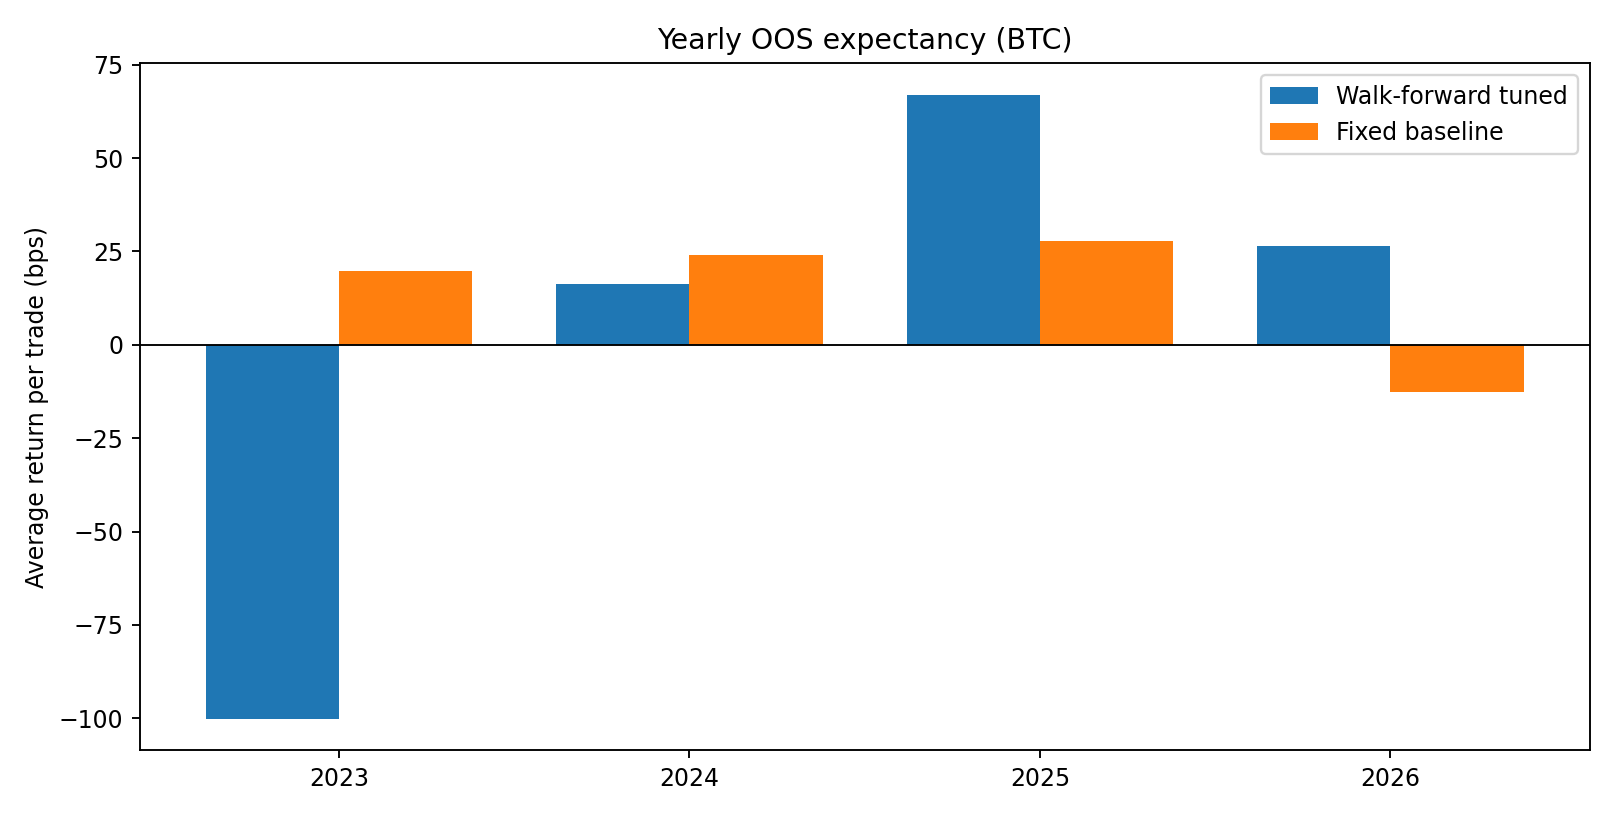
Year-by-year OOS (important)
- 2023: walk-forward was bad (tiny sample, -100 bps/trade)
- 2024: positive but weaker than baseline
- 2025: walk-forward stronger than baseline
- 2026 YTD: walk-forward positive while baseline turned negative
The instability year-to-year is exactly why I don’t trust a single backtest line.
What changed vs yesterday
Yesterday’s fixed filter looked strong. Today’s stricter validation says:
- Edge may exist, but it is parameter- and regime-sensitive.
- Generalization confidence is moderate, not high (CI crosses 0).
- 2026 behavior drift is visible already (baseline degradation).
So the right framing is:
candidate edge with improving adaptive behavior, but insufficient statistical confidence for aggressive sizing.
Reproducibility
Files in this post folder:
analyze_walkforward.pyday16b-results.jsonday16b-oos-curves.pngday16b-oos-yearly-bps.png
Core summary:
{
  "walkforward_oos_avg_bp": 24.95,
  "baseline_oos_avg_bp": 20.03,
  "walkforward_ci95_bp": [-24.73, 77.60],
  "baseline_ci95_bp": [-16.65, 56.84]
}
Next steps
- Block bootstrap (not iid bootstrap) to account for serial dependence.
- Execution realism: add spread + partial-fill model, not flat 4 bps.
- Cross-venue replication (Bybit/OKX) before treating this as structural.
- Risk layer: size down when selected parameter set has low train-trade count.
If this survives those checks, it graduates into the paper bot signal stack.
Research only, not financial advice. My standard stays the same: no cherry-picking, no pretending uncertainty doesn’t exist.